Buffon’s Needle
Pi charting
Mariana Castillo Deball
Buffon’s Needle, one of the oldest problems in the field of geometrical probability, is a random distribution experiment first posed by the French naturalist and mathematician, the Comte de Buffon (1707–1788). It involves dropping a needle on a lined sheet of paper and determining the probability of the needle crossing one of the lines on the page. The remarkable result is that, because the probability is directly related to the value of π, one can use this method to empirically measure the value of π.
Clearly, the needles can land on the paper in many ways:
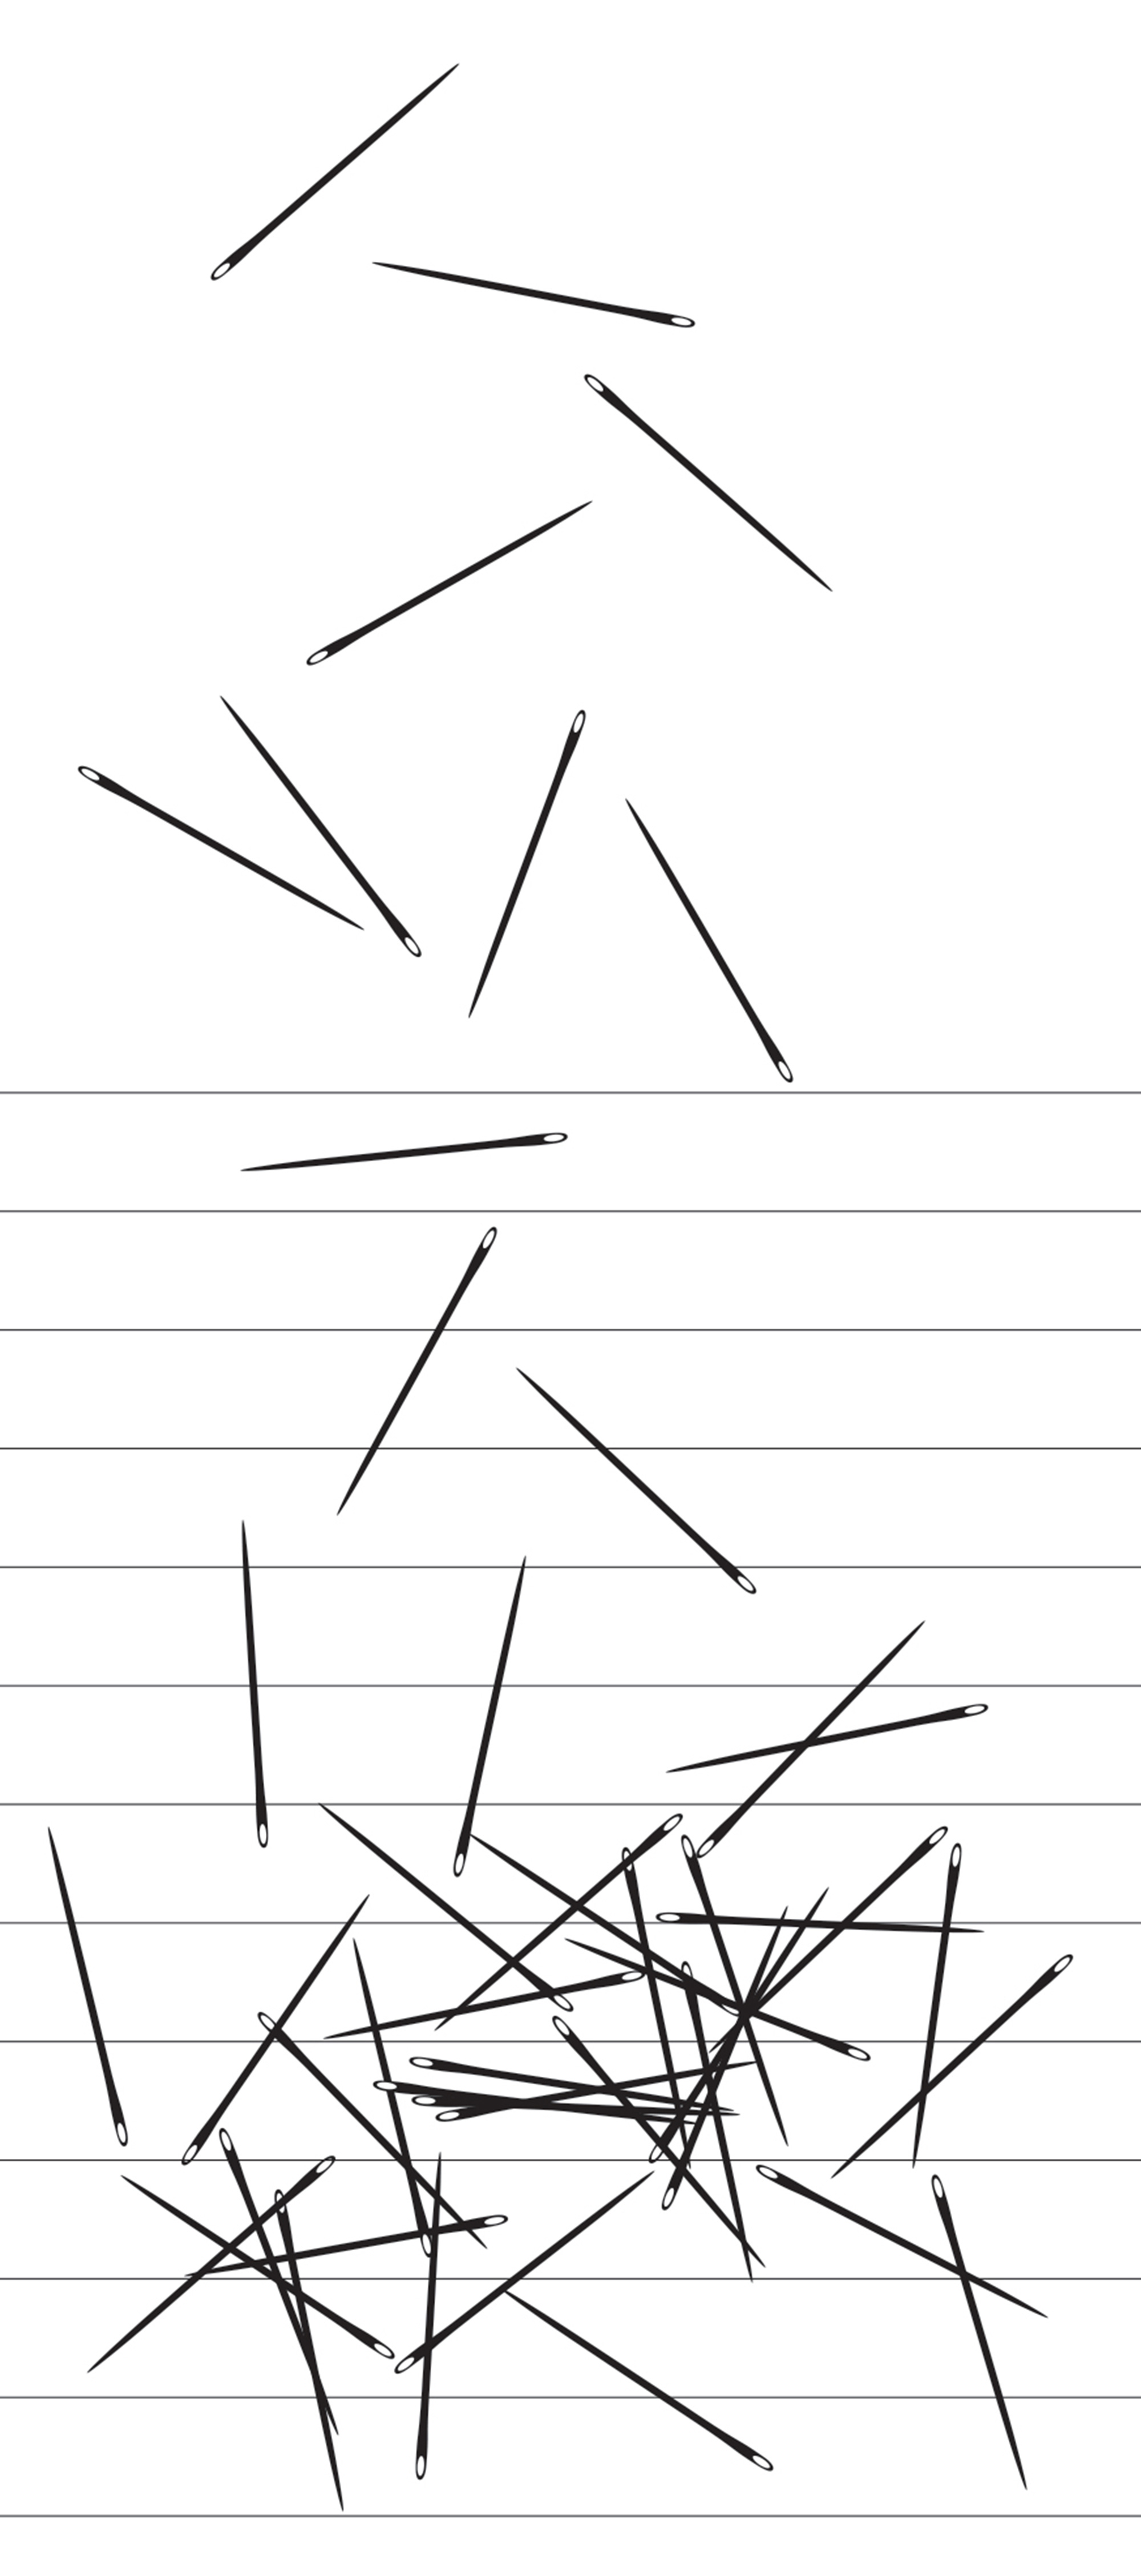
However, the position of any needle can be characterized by:
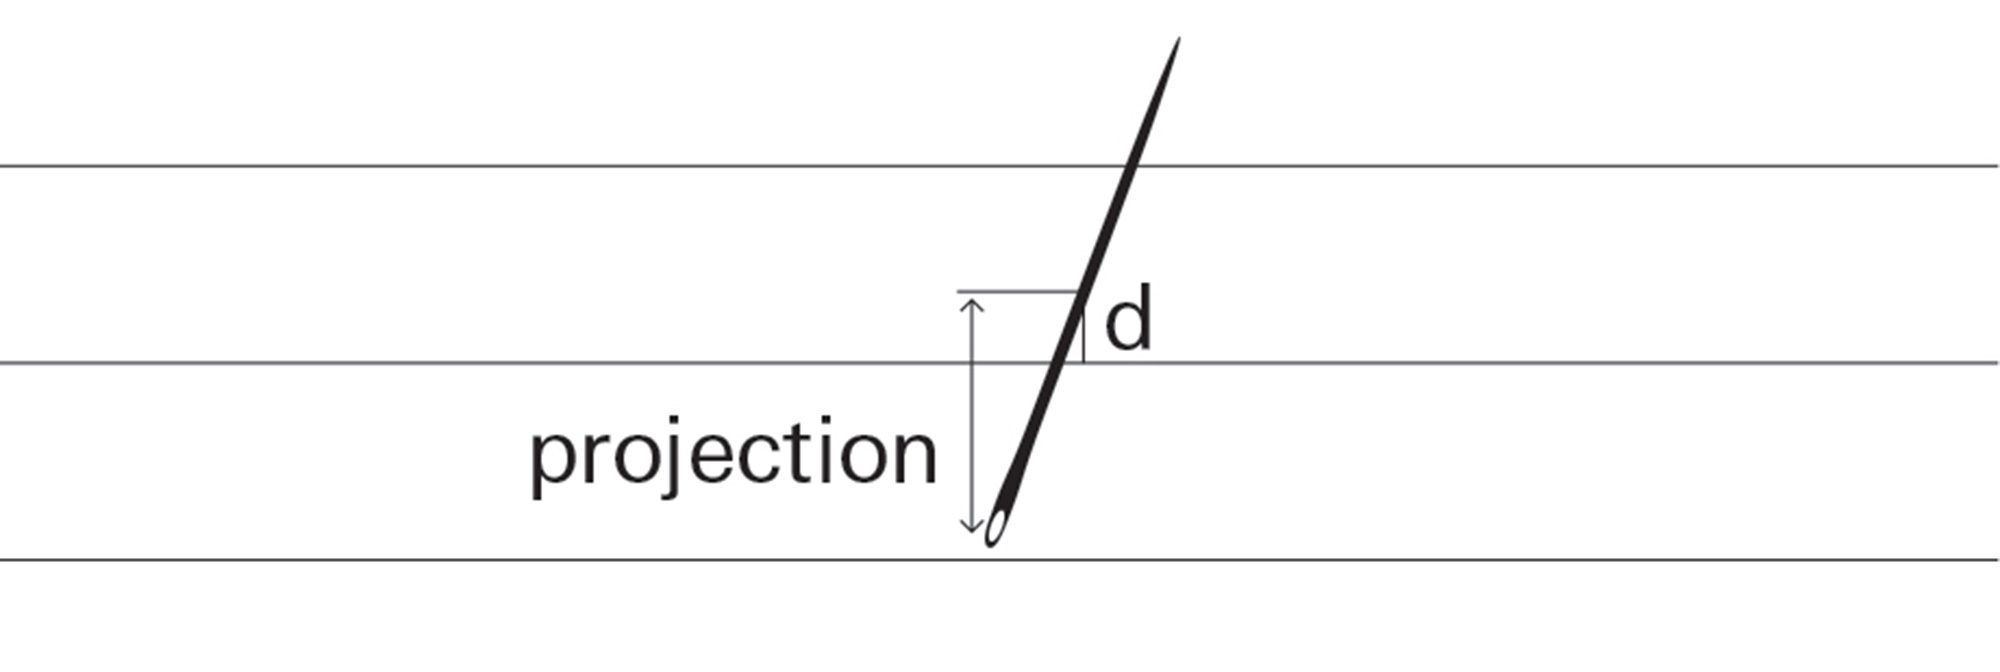
a) The distance of the center of the needle from a line, (d)
b) The angle formed with the direction of the lines, (θ)

The needle will intersect a line if the projection of half the needle length on the vertical direction is greater than distance d. For example: Projection length exceeds d, so the needle hits a line:
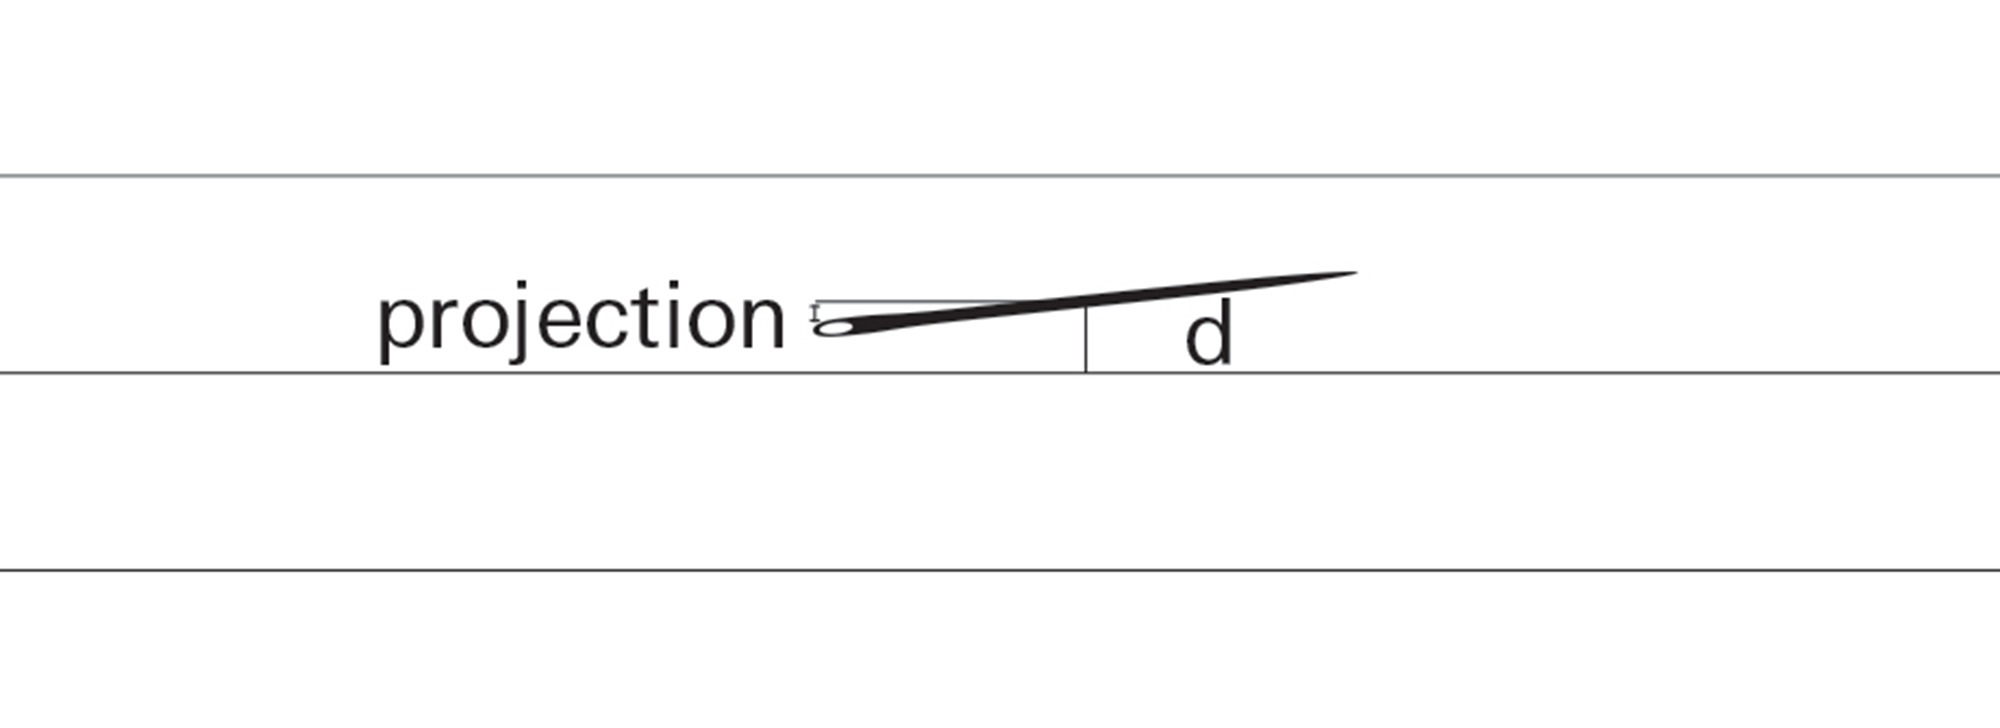
Projection length is less than d, so there is no intersection:
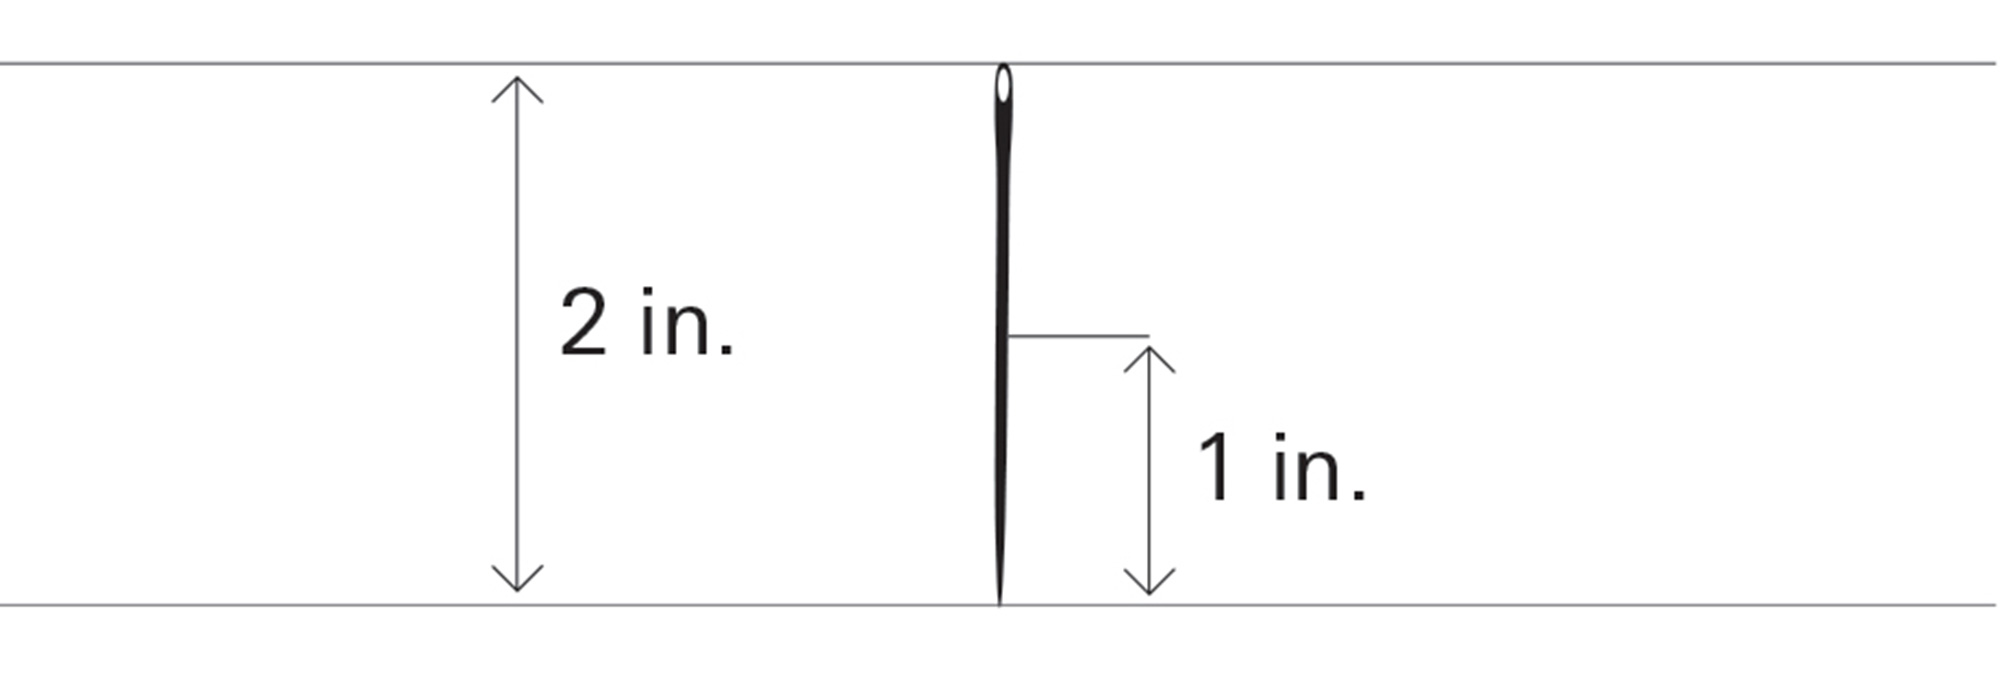
In order to actually calculate the probability that a needle will cross a line, let’s look at a specific case. We will make both the distance between the lines, and the length of a needle, each exactly 2 inches. Now, we can plot on a graph all the possible projection lengths against all the possible needle angles (these range from 0 degrees to 90 degrees, or as mathematicians prefer to say it, from 0 to π/2).
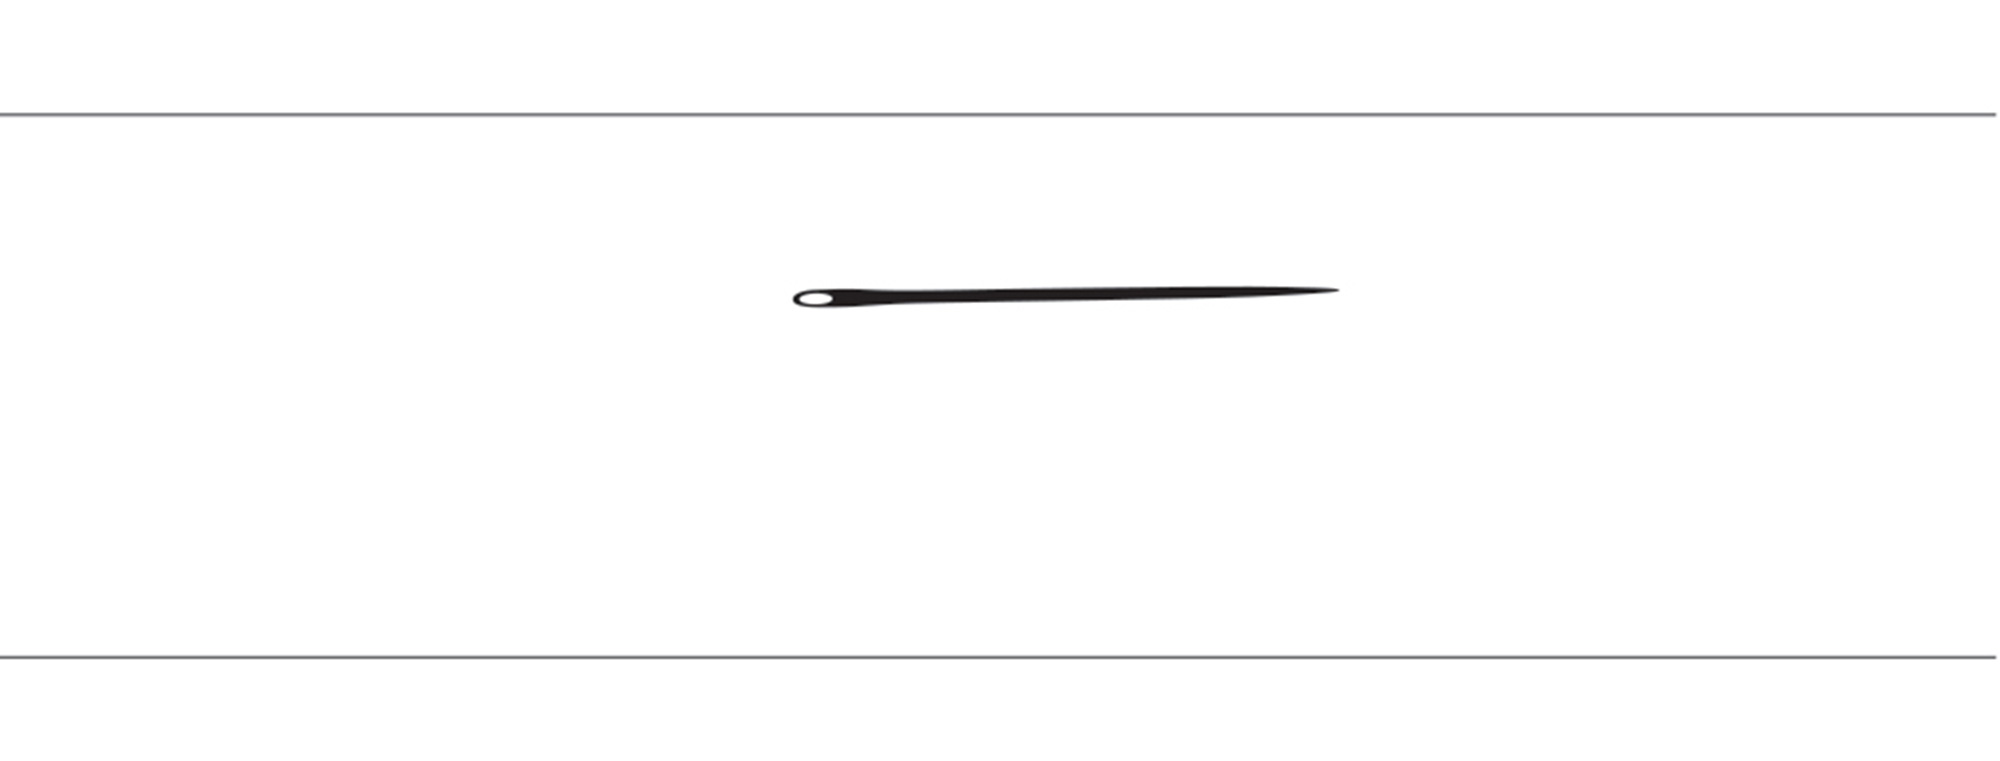
When the angle (θ) is zero, the projection is 0:
When (θ) is 90 degrees, or π/2 radians, the projection is 1 inch:
Since the “projection length” is the opposite side of a right triangle for which the hypotenuse is 1, the projection length is just the sine of the angle:
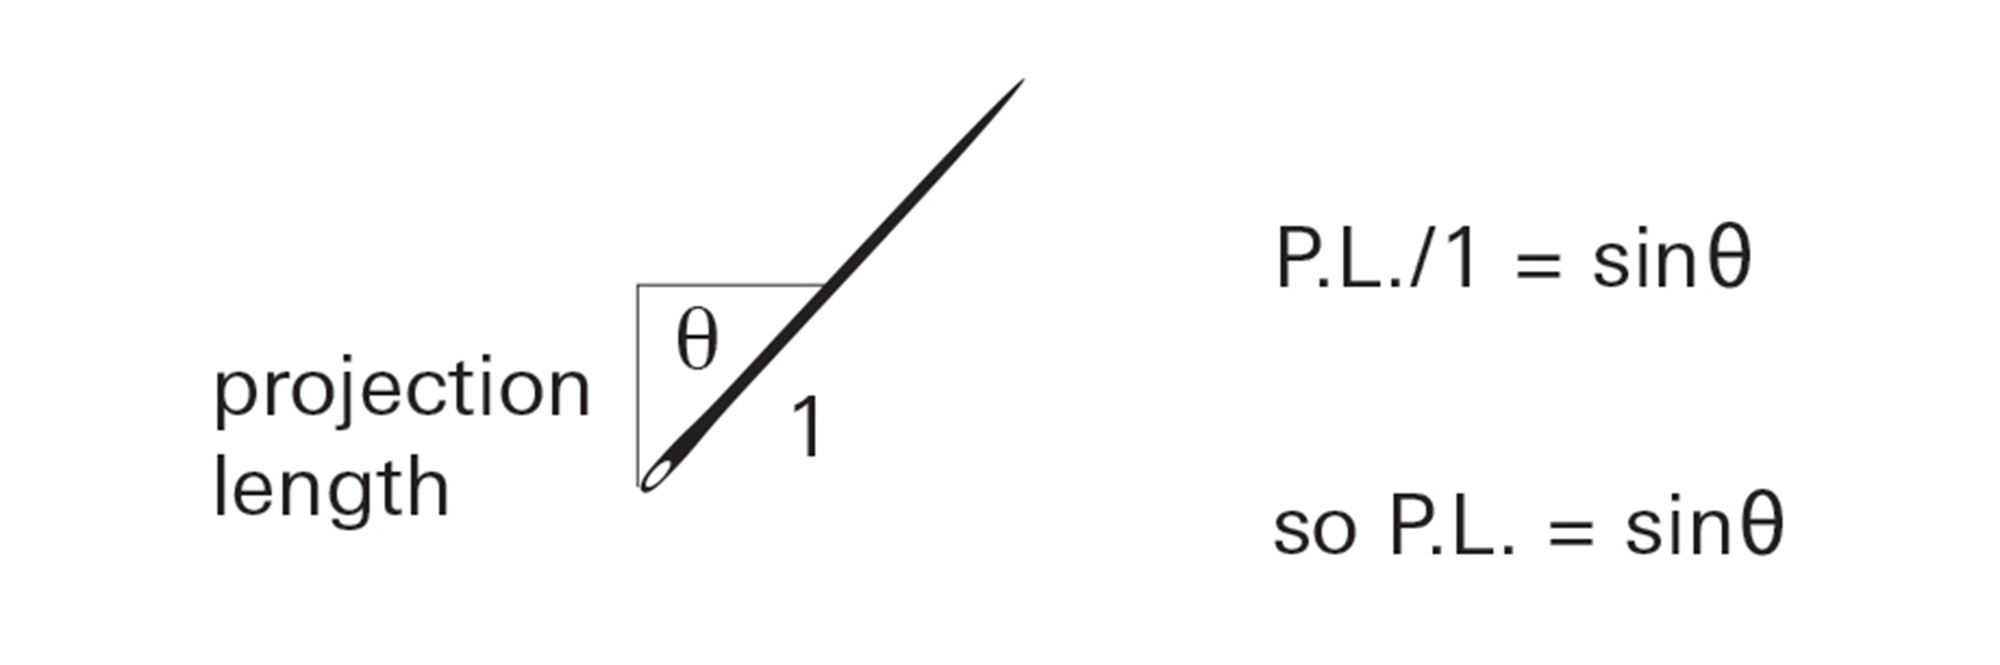
Plotting the graph of the angle versus the projection length therefore gives a simple sine graph.
We stated that the needle would intersect a line if the projection length was greater than the distance from the center of the needle to the line. Alternately, the needle crosses the line if the distance from the needle center is less than the projection length. This can now be reworded as:
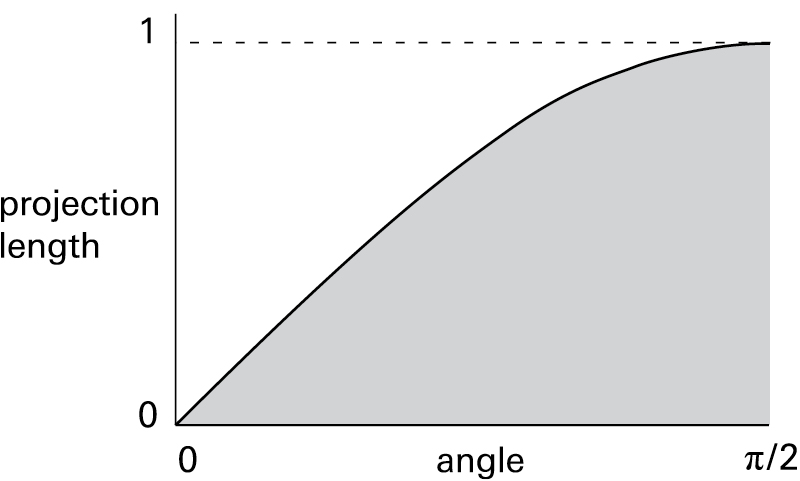
All needles whose centers are at a distance less than the sine of the angle θ will cross a line.
These needles are represented by the shaded region on the graph. The rectangle represents all possible outcomes. The ratio of the shaded area under the sine curve to the area of the entire rectangle will therefore be the probability that the needle will cross the line. The area under this portion of the sine curve can be calculated by using the method for finding the area under a curve, called “integration”:

So the area under the sine graph is 1. This means the probability of this needle intersecting a line can be stated as

This surprising result, where π appears as a probability, can be used to determine the value of π.
Let’s now generalize these results.
needle length .................... c
line separation ................... a
number of needles ............ N
number of intersections .... M
(c must be equal to or less than a)
The probability of intersection for any given needle, M divided N, =

Therefore, 
The more needles are thrown, the more accurate will be the figure for π yielded by this empirical method.
The graph published in the print edition of this issue was incorrect. We regret the error, and thank Erik Henriksen for bringing it to our attention.
Mariana Castillo Deball is a Mexican artist based in Amsterdam and Berlin. Recent projects include Interlude: the reader’s traces, an intervention at the National Library in Paris, the Public Library in New York, and the National Library in Berlin; Institute of Chance at the International Institute of Social Studies, Amsterdam; and Never Odd or Even. In 2004, she was awarded the Prix de Rome/Netherlands.
Spotted an error? Email us at corrections at cabinetmagazine dot org.
If you’ve enjoyed the free articles that we offer on our site, please consider subscribing to our nonprofit magazine, which includes unlimited access to all our archives.